Fine Lines by Hanna logo

Infographics

Your idea distilled into a drawing

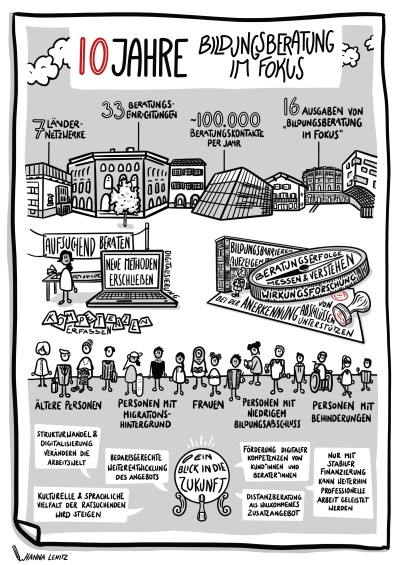
A visual summary of the table of contents of the 10th birthday anniversary issue of a magazine.

Visual table of contents

Visuals have the potential to make almost anything better, even the most boring part of a document: the table of contents. Visualizing the different items gives readers an overview over the subject covered and entices them to read on: win-win!

What better way is there to celebrate the 10th birthday of a magazine than a visual summary of the anniversary issue? See the full magazine.

Slide 1 of 2
  • Visualization of a table from a research paper by Panteia on the risks self-employed workers have to deal with.
  • Visual summary of an evaluation on the method used to support refugees in their integration and participation process in the Drechtsteden area (NL).

Data visualizations and visual research summaries

I love data as a way to understand our world better. However, we have to acknowledge that only nerds will read the full 60 pages of a report. Looking for a way to share the main take-aways of your research in an accessible way? Visualization can help!

Visualization of a table from a research paper by Panteia on the risks self-employed workers have to deal with. Read more about the research.

Slide 1 of 2
  • Client journey for the project ‘Schouders onder stress’ (tackling stress) which helps single parents who experience stress in their finances and other areas of life.
  • Process visual for ‘Ketenaanpak schulden’ (chain cooperation to help people in debt) which streamlines the way people with debt and financial problems are supported in the municipality of Dordrecht (NL).

Process visuals

Writing out a complex process and communicating it to professionals and clients can be cumbersome. Visualization is a powerful tool to help reveal flaws and create a common base for communication - everyone is talking about the same thing. The resulting visual gives new professionals and/or clients a concise and clear summary of what they can expect.

Client journey for the project ‘Schouders onder stress’ (tackling stress) which helps single parents who experience stress in their finances and other areas of life.

Slide 1 of 11
  • Title Slide for the Scarcity Explained Series
  • Drawing of a suitcase with the text: "Let's pretend that your monthly budget is a suitcase"
  • The suitcase has been folded open and contains expense items, such as rent, savings, or education. Around it the text: "With an average income you have enough space for essential and not so essential living expenses.
  • A drawing of a small suitcase, the size of the banana that is there for scale. Above it the text: "People with a low income have a tiny suitcase."
  • Depiction of how not all necessary expenses will fit in that tiny suitcase. Above it: "And every month they have to figure out how to fit the necessary expenses inside (the tiny suitcase)."
  • Thought bubbles coming from the text: "They are constantly thinking about their suitcase"
  • A brain with a suitcase handle: "A full suitcase makes for a full mind"
  • A cluttered image, full with types of expenses; "There is no space to think about long-term solutions."
  • A woman holding her head, we can peek inside her head, which is full of suitcases. "Scarcity is a process, not a choice"
  • An empty open suitcase, in it is written: "See someone struggling with a tiny suitcase?"
  • A tiny suitcase being lifted by a balloon. Next to it, it says: "Recognize the scarcity and if you can, alleviate it.

Explanation series

Do you have an idea or story that needs to be told in a more narrative way? I’ve got you covered!

The concept of scarcity (coined by Sendhil Mullainathan) is of vital importance to everyone working with people that have too little of something. I wanted to contribute to the spread of the idea of scarcity, so I decided to make a simple, visual explanation series that could be shared online.

Slide 1 of 2
  • J's personal journey as a CEO.
  •  I started visualizing content during my traineeship as a policy officer. We got time off to focus on something we were interested in and I decided to follow a training and put the content into drawing – the start of a much longer journey which I haven’t put into drawing… yet.

Personal journeys

Want to show where you came from, what you experienced on the way and where you are now? Visuals can be the perfect base to tell your story – whether personal or professional.

I was asked to visualize a personal story of J's journey as a CEO. This is what J is said about the project: "Hanna is a perceptive listener and asks pertinent questions to understand what I was looking for. We collaborated together throughout the exercise. The finished product exceeded my expectations and was a beautiful representation of my lived experience."

You have a visualization idea that is unlike anything I have done so far? Let me know about it!

[Your Idea Here]

You have a visualization idea that is unlike anything I have done so far? I’m with Pippi Longstocking on all new ideas: ‘I have never done it, so I think I can.’ Just contact me and explain what you have in mind, I am sure that we can work out a way to make it happen.

;

Do you have questions about my work, visualization requests or just want to chat about an idea you have?

Send me a message!